By Stan Nicol, M.ED., Director, Data Analytics
The Buckeye Community Hope Foundation (BCHF) continues to expand its data analysis services for its sponsored schools. We collect and analyze a wide range of data, including Ohio State Tests, Norm-Referenced assessments, Item analysis, and attendance records. With this extensive data, we provide schools with detailed analyses of student learning. Item analysis is our newest addition. BCHF has collected data for this analysis for the past four spring state testing administrations to provide us with strong trend information. An example of our state testing analysis may include the following:
Overall Assessment-Proficiency, Performance Index
Subject Analysis-Math, English Language Arts (ELA), Science and Social Studies
Domain Analysis- Fraction, Writing, Reading, Life Science, etc.
Standard Performance
Ohio State Tests cover up to four subjects, with each subject organized into three to five domains. Individual Ohio Learning Standards further define each domain.
We recently added multi-year Domain Analysis to our report bundle. This report uses all available data to identify the domains with the highest and lowest historical trends in pupil performance. A sample version of this report, using portfolio-wide data (data not specific to one school), appears below.
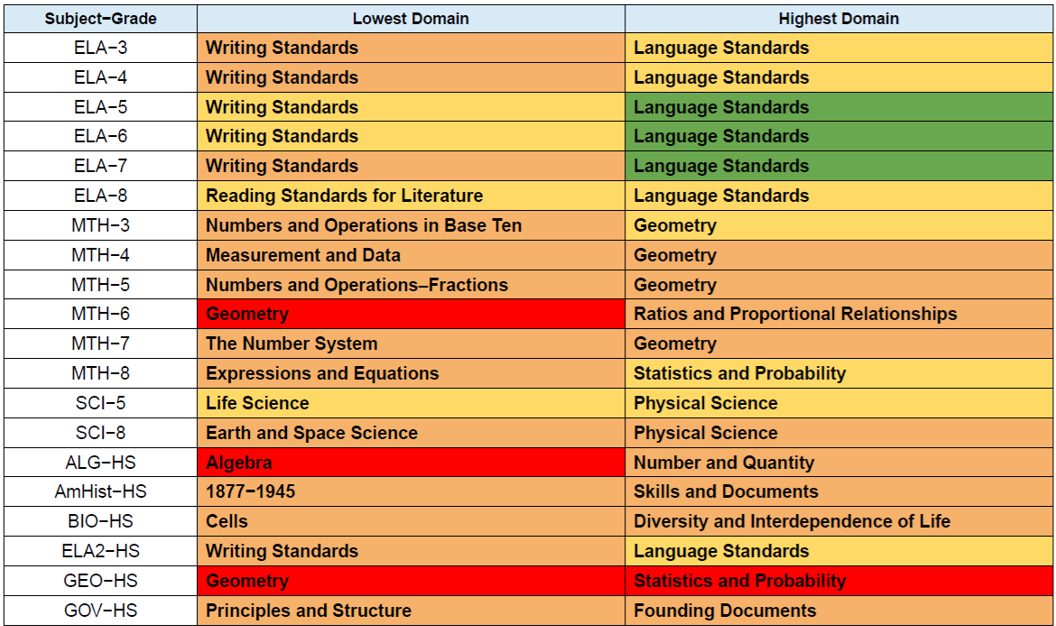 |
Domain areas are color-coded by median performance. Each of our more than fifty sponsored schools receives this report, along with additional reports that break performance down by individual learning standards.
In the sample above, the middle column, or “lowest domain” column shows areas of need in student learning in English Language Arts. Across BCHF’s portfolio of schools, we see an overriding need for improvement in student performance on writing standards. Student performance on these standards would be further analyzed by the prompt type used on ELA assessments. The type of writing prompts includes opinion and informative writing for grades 3-5. For grades 6-12, writing prompts include argumentative and explanatory writing. In addition, students may be writing in response to two literacy passages or two informative passages. Comparison of individual writing scores informs us further as to whether students need more work on the organization or elaboration of their writing or writing conventions.
Looking at lowest domains in mathematics on the chart, younger students in grade 3 need to improve in numbers and operations – base ten whereas fifth grade students need more practice with numbers and operations – fractions.
Areas in green are domains where students in BCHF are performing better. “Highest domain” areas still represent Ohio learning standards that should be taught and assessed.
Armed with this level of data, school leaders and teaching teams can ensure that standards within these domains are incorporated into teaching and learning experiences, assessed, and reviewed as needed to support student learning. BCHF’s School Improvement department staff can also tailor support to each school’s specific needs as indicated by this data. The BCHF School Improvement team has representatives with subject-area expertise in specific academic subject areas. We invite you to reach out to your school’s data representative to help further match domain data to school improvement strategies.