By Stan Nicol, Data Analysis, BCHF Accountability and School Improvement Team
When it comes to analyzing Ohio State Test results, the amount of Writing data is unsurpassed. For each State assessment, the results include an overall performance along with each sub score area performance. An example of this would be the area of “Functions” on the eighth-grade mathematics assessment. The State rates the performance on “Function” related questions as “Below,” At/Near” or “Above” the standard. With scores in writing on Ohio’s ELA tests, the data are much more detailed. With a little digging, we can glean additional information to truly guide instruction and build student writing competency.
How is Writing scored? Along with two reading performance scores, Informational and Literary, writing proficiency is based on one or two writing samples depending upon the grade level of the students. Grade three through five have either an Opinion or Informational writing assignment. Grades sixth through high school ELA 2 have two writing assignments. The upper grades write both an Argumentative and an Informational piece. The State scores these as Below, At/Near, or Above just as they do the other sub scored areas. When we dig even deeper into the data, we can learn more about the writing abilities of our students. Writing raw scores range between zero and ten points. The dimension score of Organization and Elaboration are worth one to four points each and Conventions are worth zero to two points. The State provides these results in detail for Writing results.
How does the Buckeye Community Hope Foundation analyze these data and provide feedback to member schools? Figure 1 below shows the Writing Proficiency from the spring 2024 Ohio State tests.
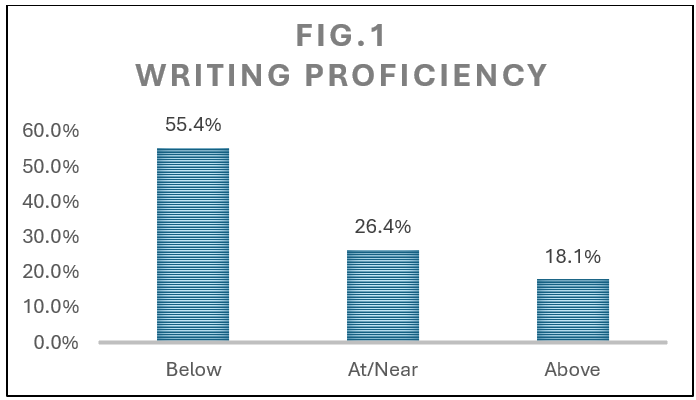
These results show us that 55.4% of our students were below proficiency in writing as of the time of the State testing. But, as we saw above, there are three types of writing prompts: informational, opinion, and argumentation. The writing rubric provides us with sub scores, allowing us to dig deeper. It is this data that can really guide our schools in targeting writing instruction to meet the precise needs of students.
These charts show the dimension area scoring for all student populations and all school types.
Chart 1.
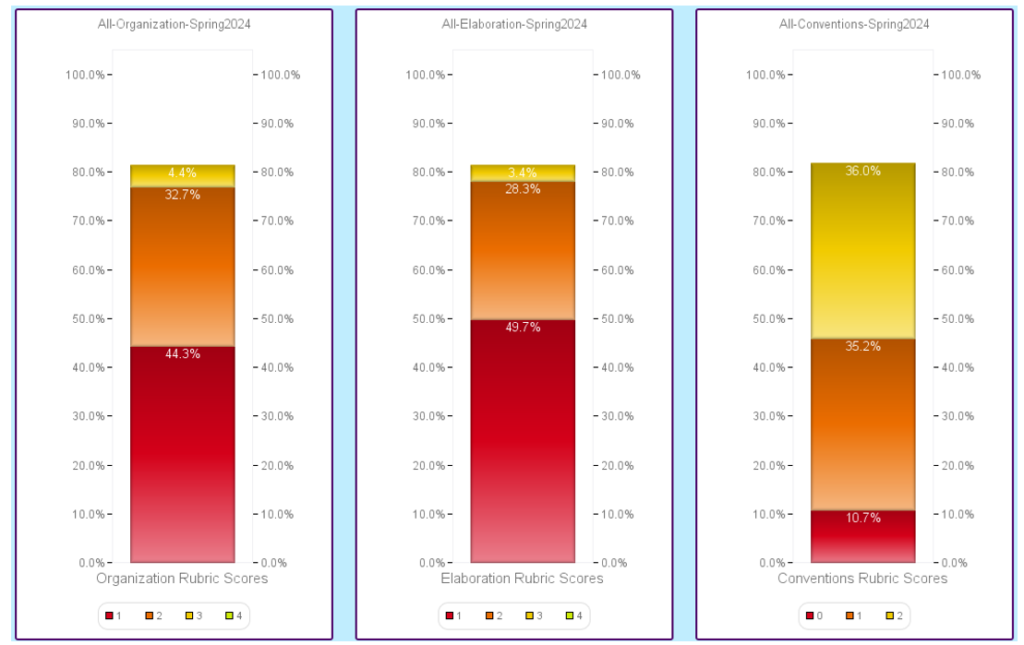
The data show that our students have lower scores in Elaboration with 49.7% of the students scoring a “1” on the rubric, and only 3.4% received the full credit of “4” for this sub score. On organization, 44.3% of students received a “1” and 4.4% of students received a “4,” or full credit for organization. The question becomes: How are teachers instructing students so that they build elaborate support for major points made in their writing.
A closer look and you will see that the graphs do not add up to 100%. Sometimes students’ writing results do not receive a score. While the State assigns a zero, additional information gives us insight as to why the score was not determined. With the above example, 18.5% of the students did not receive a score. The chart below breaks down by writing prompt type, the percentage of students in which the writing did not receive a score.
Chart 2.
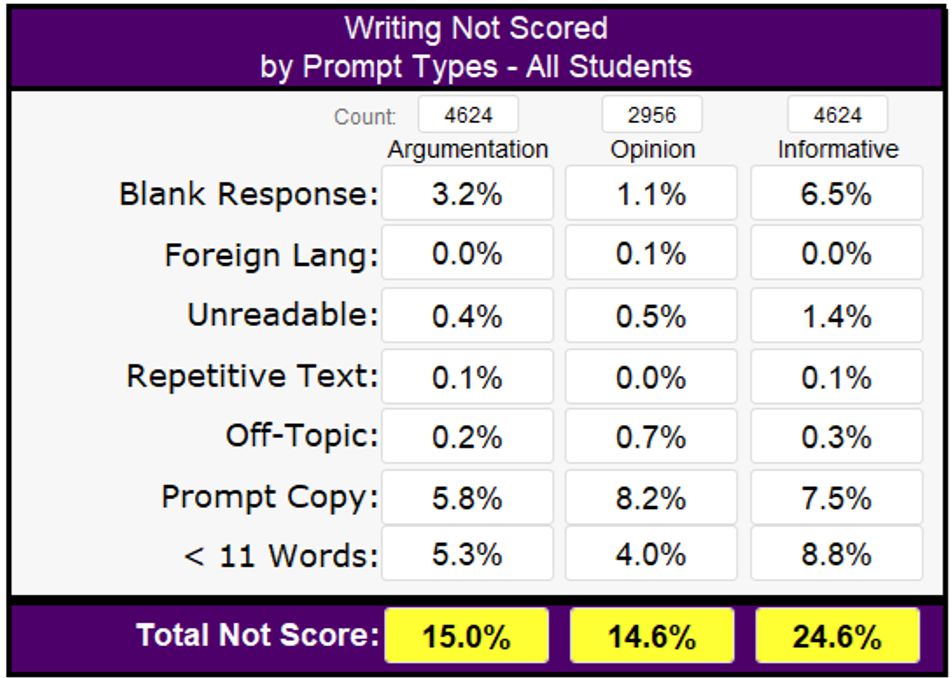
It is with this additional information we can determine that “Informative” writing causes more of a struggle for our students. When we only look at the proficiency by dimension score for each writing prompt there is minor difference. Figure 2 below shows proficiency by writing prompt along with the percentage of student writing not scored.
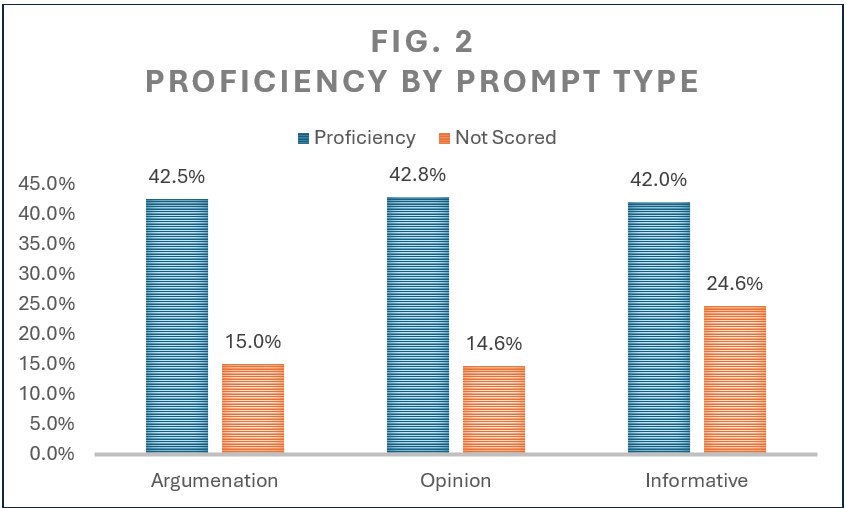
Simply evaluating the proficiency scores does not give us enough information as all three prompt types scored around 42% of the possible rubric score points. (ten)
Seeing these data together shows us that “Informational” writing is an area of need in our schools.
Over the last few months, we have fine-tuned our data warehouse to help our schools analyze data such as these. With the addition of Secure Data Center information, we can filter such information by additional parameters such as Students with Disabilities, Multi-Lingual Learners, and more subgroups depending on the school’s demographic make-up.
Are you and your team interested in digging deeper into the writing needs of your students? If so, be sure to schedule a data dive in late summer or early fall to see the strengths and weaknesses in your school’s test results.
To schedule, reach out to Stan Nicol: snicol@buckeyehope.org